

This Market Update is written by our Capital Market specialists each week to bring you insight into what's happening in the market and how it may affect mortgage rates and real estate trends.
Market Commentary:
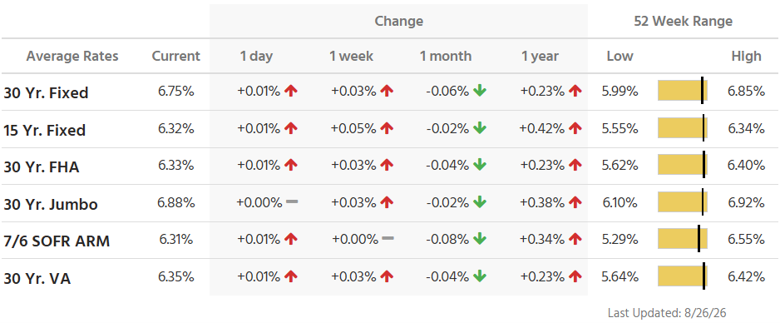
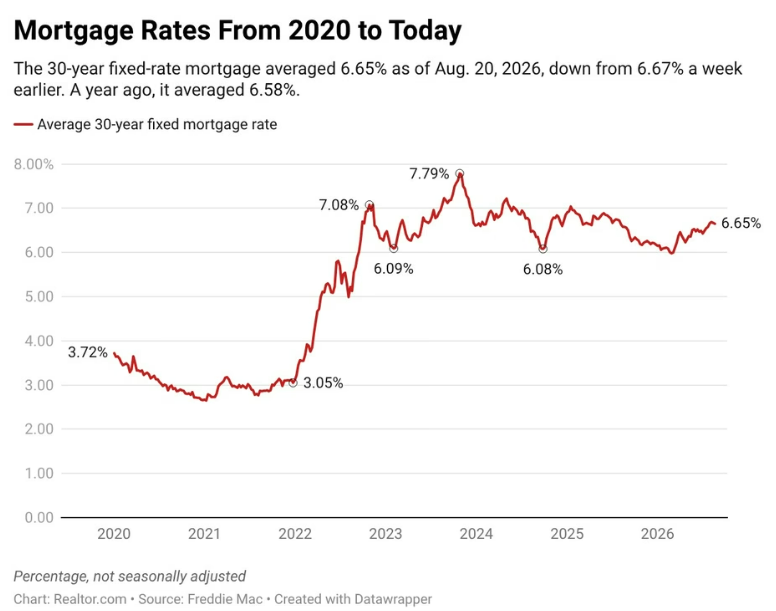
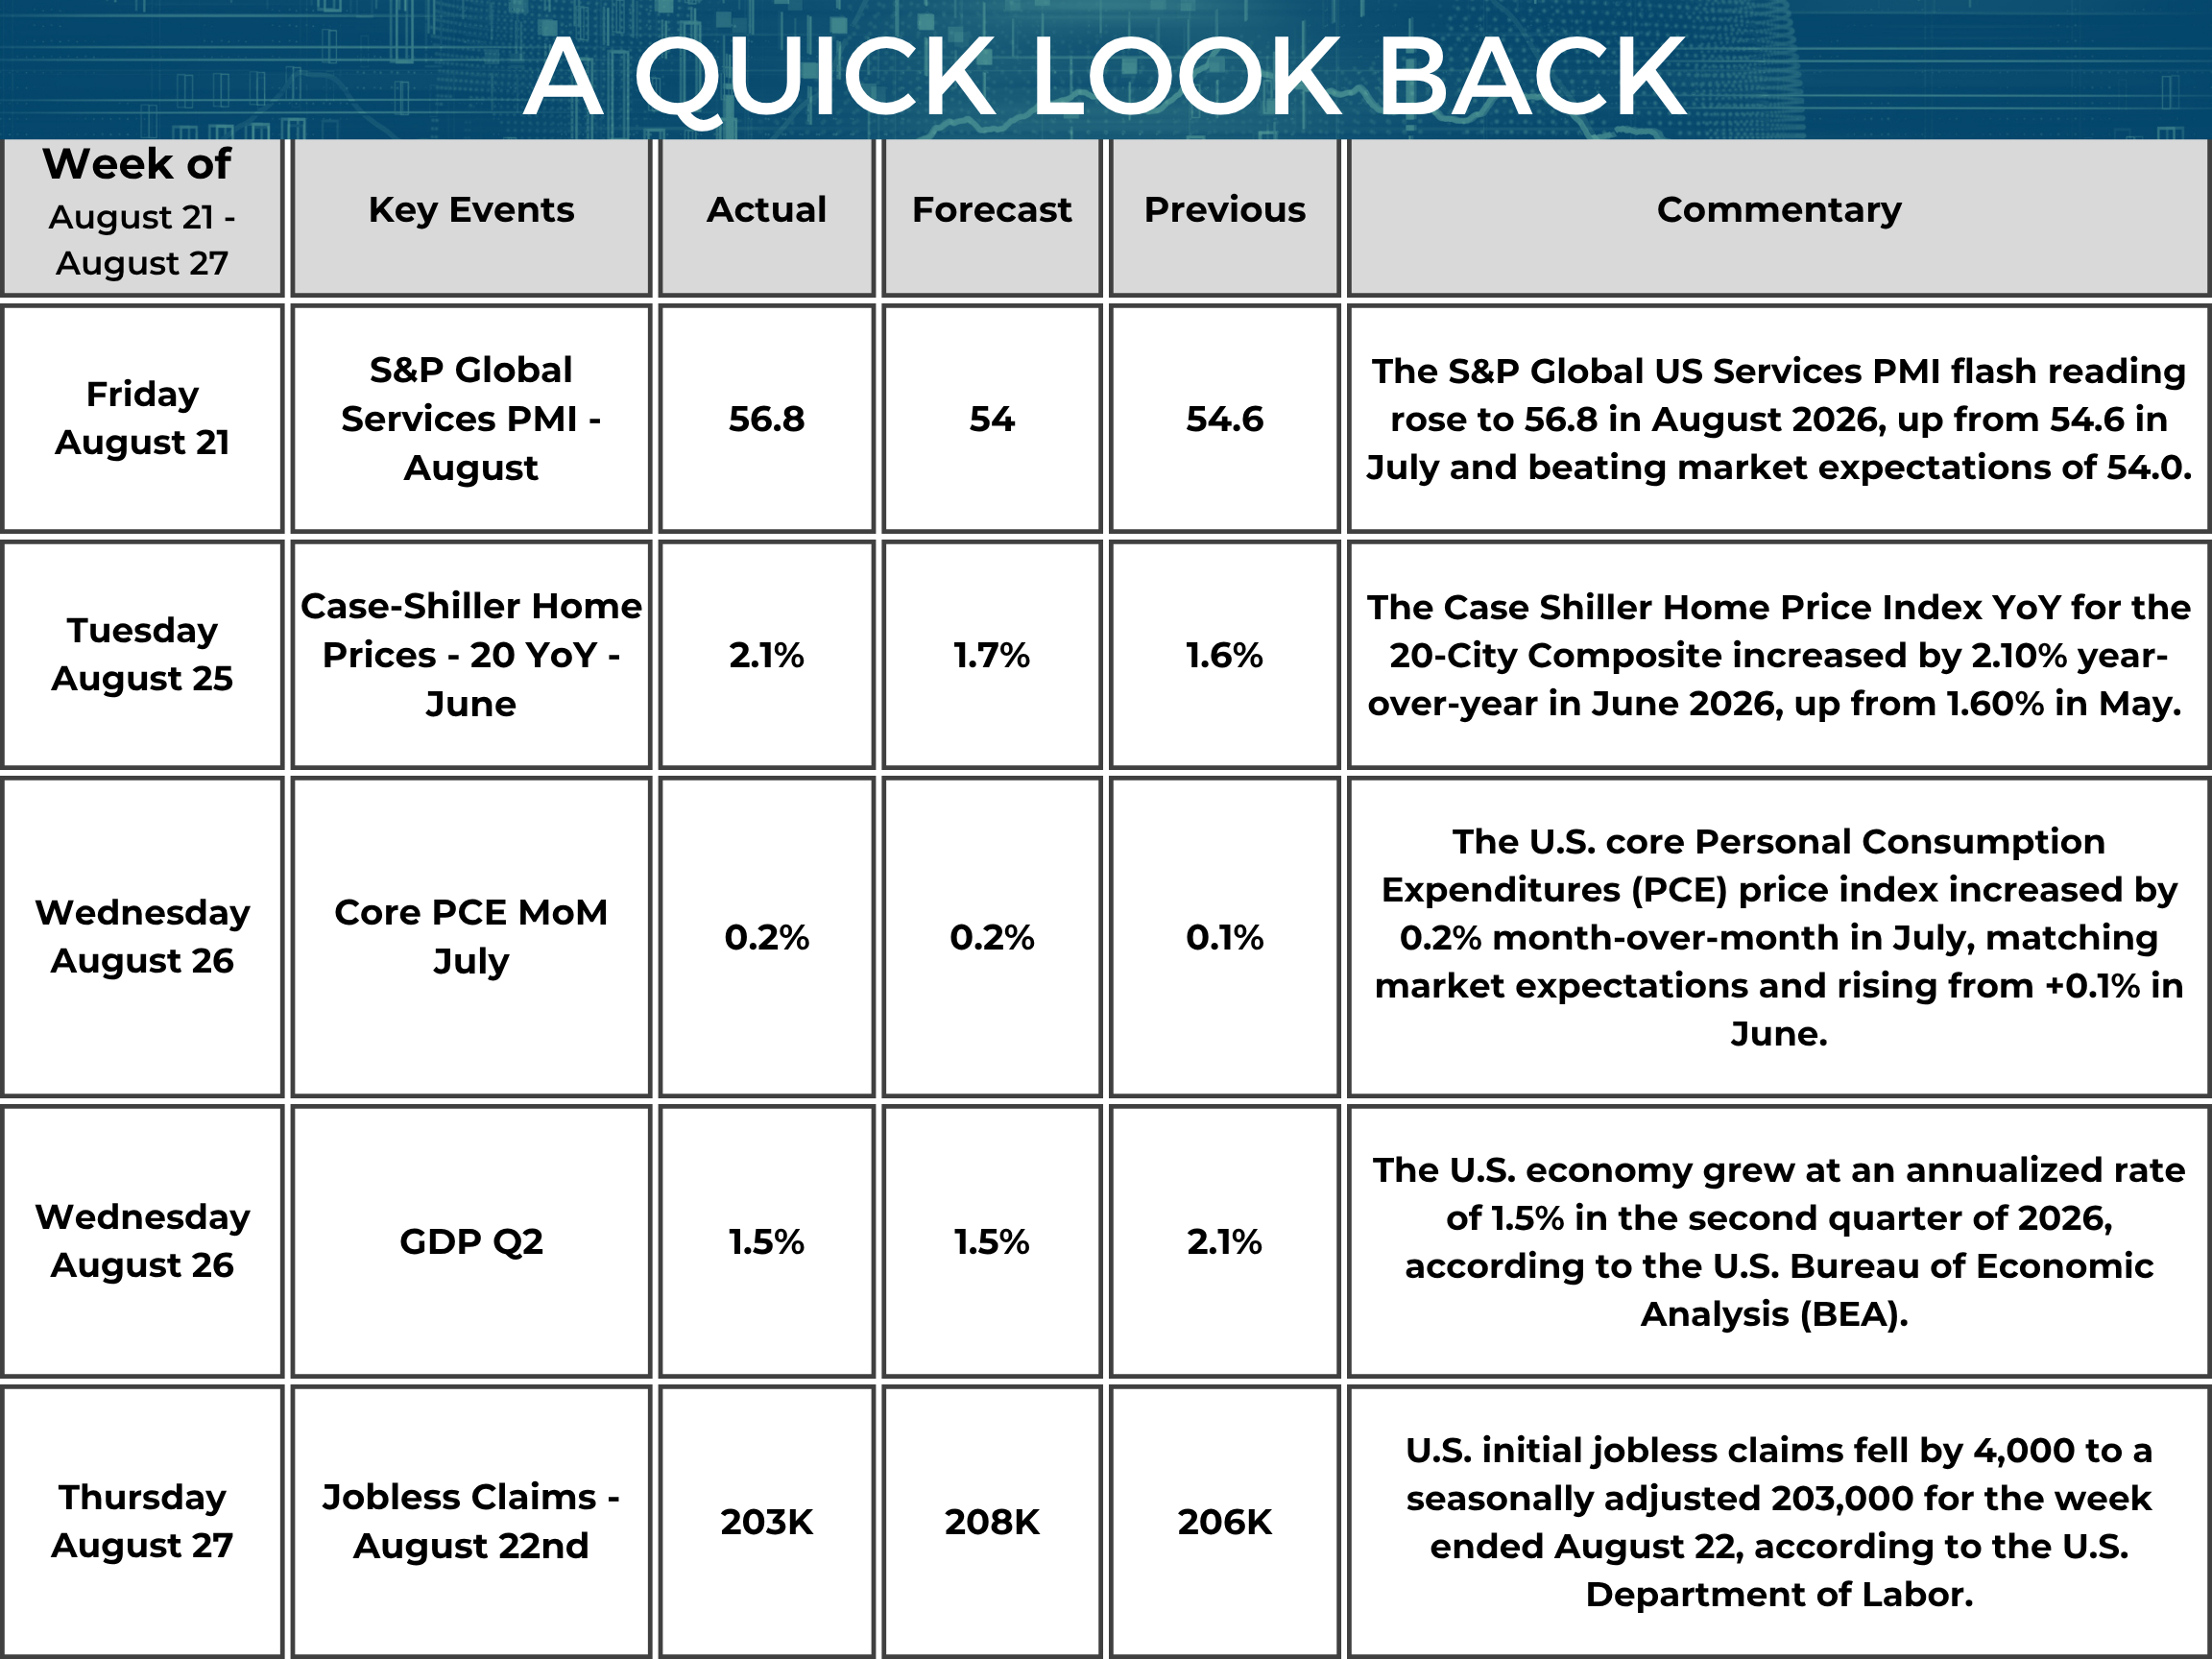
Average fixed mortgage rates showed brief, incremental dips earlier in the week before experiencing mid-week volatility tied to U.S. Treasury yield movements. The week ended with daily rates ticking back up toward the upper 6.00% to low 7.00% range, depending on product type and loan adjustments.
Fixed rates continues to follow movements in the 10-year U.S. Treasury yield. Earlier Treasury buyback announcements offered brief stabilization, but persistent bond market volatility brought rate pressure back by August 27.
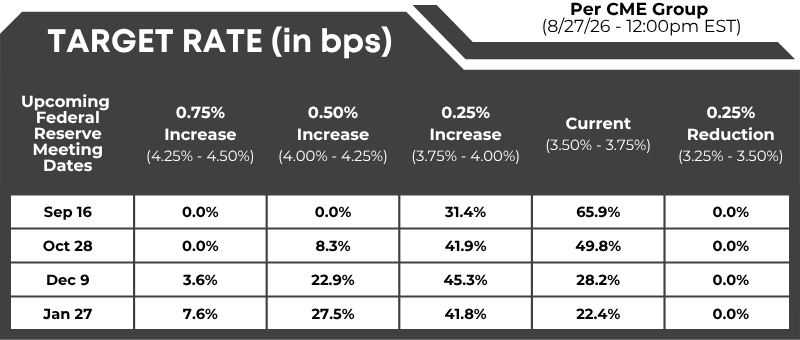
The Federal Open Market Committee(FOMC) has maintained the target federal funds rate in the 3.50% to 3.75% range. With the Fed taking a cautious pause, mortgage rates remain sensitive to inflation prints and bond auctions.
While benchmark rates hovering in the mid-to-upper 6% range are higher than a year ago, inventory is improving in several markets. Slight rate dips trigger quick spikes in buyer activity; shopping now allows buyers to negotiate concessions or price adjustments without getting caught in sudden bidding wars. Temporary rate buydowns can ease initial monthly payments. Pre-approvals can position clients to lock in immediately whenever daily rate drops occur.
FedWatch: Target rate (in bps) possibilities, according to the CME Group (as of 08/27/2026– 12:00 PM EST):
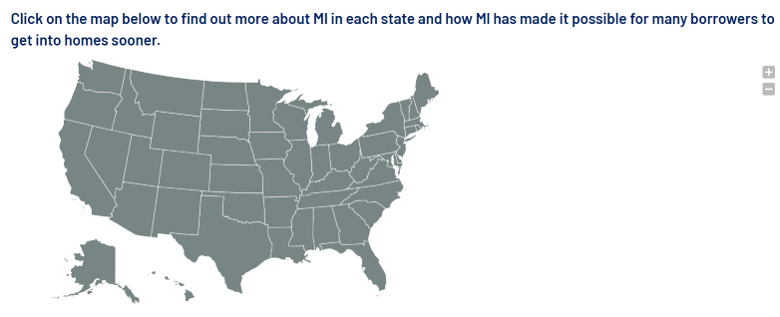
Private MI: Helping millions of Americans become homeowners each year. State Mortgage Insurance | USMI
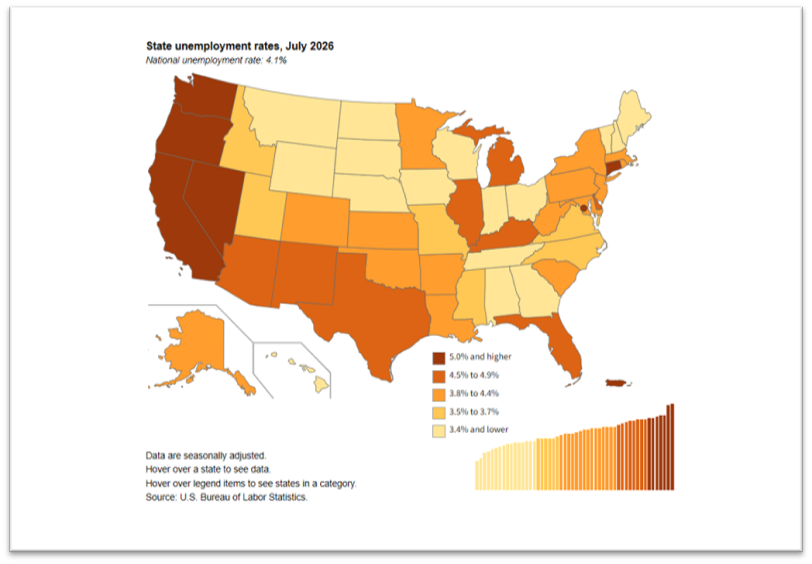
Unemployment Rates Were Lower in 10 States in July 2026
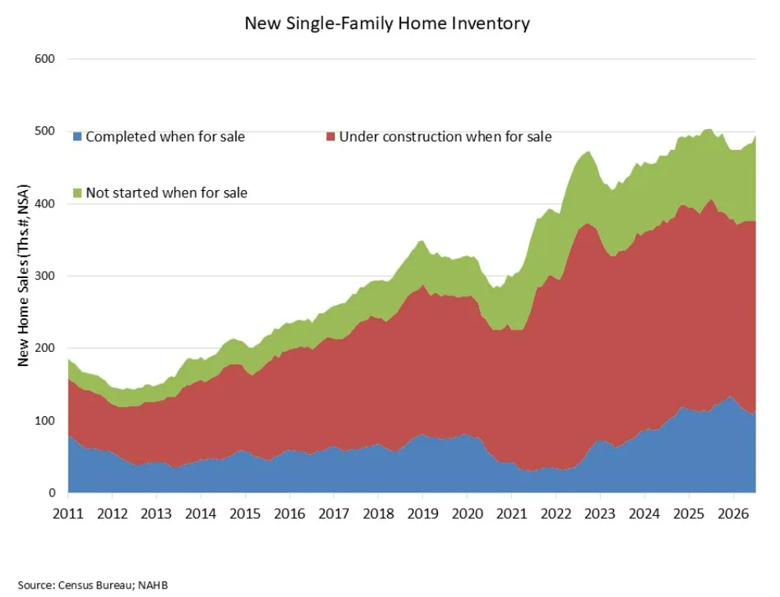
Economic Uncertainty, Affordability Challenges Weigh on New Home Sales
Deficit Danger
While the US debt just crossed the $40 trillion mark, what matters much more is debt held by the public, and it’s “only” $32.3 trillion. The difference is intragovernmental debt. But even that number needs context. The critical number: the debt-to-GDP ratio, which, with 26Q2 GDP at roughly $32.5 trillion, is about 100%, near levels last seen just after WWII. The real problem; the staggeringly large 6% annual deficit. - Elliot Eisenberg, Economist
News You Can Use:
· PCE Inflation Remains Sticky – Eye On Housing
· Fed’s preferred inflation gauge shows core prices rose 3.3% annually in July
· Cash is no longer king in home sales
· 30-Year Treasury Yield Hits a 19-Year High. What That Means for Your Mortgage
· New Listings Hit 4-Month High While Demand Slips, Giving Serious Buyers Chance to Get a Deal Done
· Mortgage Applications Fall as Elevated Rates Discourage Late-Summer Buyers
· HOA struggles, condo crisis worse than headlines suggest, lender warns | Mortgage Professional
· Realtor.com® Research - Housing Data & Real Estate Market Trends
*Communication is intended for Industry Professionals only and not intended for Consumer Distribution
Interest rate and annual percentage rate (APR) are based on current market conditions as of 08/27/2026, are for informational purposes only, are subject to change without notice and may be subject to pricing add-ons related to property type, loan amount, loan-to-value, credit score and other variables. Estimated closing costs used in the APR calculation are assumed to be paid by the borrower at closing. If the closing costs are financed, the loan, APR and payment amounts will be higher. Contact us for details. Additional loan programs may be available. Accuracy is not guaranteed, and all products may not be available in all borrower's geographical areas and are based on their individual situation. This is not a credit decision or a commitment to lend. Actual interest rate, APR, and payment may vary based on the specific terms of the loan selected, verification of information, your credit history, the location and type of property, and other factors as determined by Prosperity Home Mortgage, LLC. Not available in all states. Rate is as of 08/27/2026 and is subject to change at any time without notice. Opinions, estimates, forecasts, and other views contained in this document are those of Freddie Mac’s economists and other researchers, do not necessarily represent the views of Freddie Mac or its management, and should not be construed as indicating Freddie Mac’s business prospects or expected results. Although the authors attempt to provide reliable, useful information, they do not guarantee that the information or other content in this document is accurate, current, or suitable for any particular purpose. All content is subject to change without notice. All content is provided on an “as is” basis, with no warranties of any kind whatsoever. Information from this document may be used with proper attribution.









.png)


.png)


